Research & Publications
Multi-Stage Alzheimer’s Disease Prediction Using Multihead Attention based CNN-BiGRU with XAI
By Rajaul Karim | 08 Oct, 2025

Type: Conference proceedings
Conference Name: 2025 2nd International Conference on Next-Generation Computing, IoT and Machine Learning (NCIM)
Index: Scopus, IEEE Explore
Date: 27-28 June 2025.
Organized by: Dept. of CSE, Dhaka University of Engineering & Technology, Gazipur
🔗 Doi (Click here): 10.1109/NCIM65934.2025.11159870
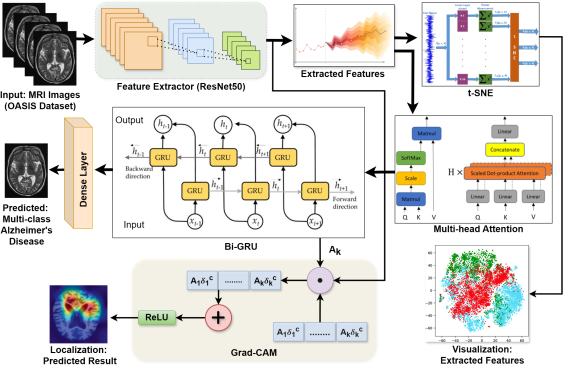
Abstract: Alzheimer's disease is a progressive form of dementia that deteriorates memory, cognition, and behavior, eventually impairing daily activities and causing brain damage, making it a significant global health concern. Conventional diagnostic techniques, such as manual brain image evaluations and cognitive assessments, often require significant time, prone to errors, and reliant on expert availability, underscoring the need for an automated, efficient, and transparent detection method. While substantial research has been conducted using brain MRI images and CNNs, challenges remain in achieving high performance and transparency on complex multiclass datasets with overlapping features. This study introduces a hybrid method that combines CNN for feature extraction, Multi-Head Attention to capture temporal dependencies, and BiGRU for sequential classification of Alzheimer's stages. Grad-CAM and t-SNE visualizations enhance explainability, offering valuable insights into stage detection and improving model transparency. Using the OASIS dataset, the proposed method effectively addresses challenges arising from feature overlap and class imbalance, achieving 95% accuracy, with precision, recall, and F1-scores of 94.79%, 94.82%, and 94.76%, respectively, outperforming existing methods on 2D MRI data. This hybrid approach presents an effective tool for precise multistage Alzheimer's detection, localization, and monitoring, offering cost efficiency, fostering trust in AI-driven diagnostics, and streamlining autonomous healthcare solutions.
.png)
GradCAM highlight the model’s decision-making process during dementia stage prediction. For each stage, randomly selected images from the test set demonstrate re- gions with increased attention marked in red and areas with decreased attention marked in blue during the predictions.


